Monitor
SLA
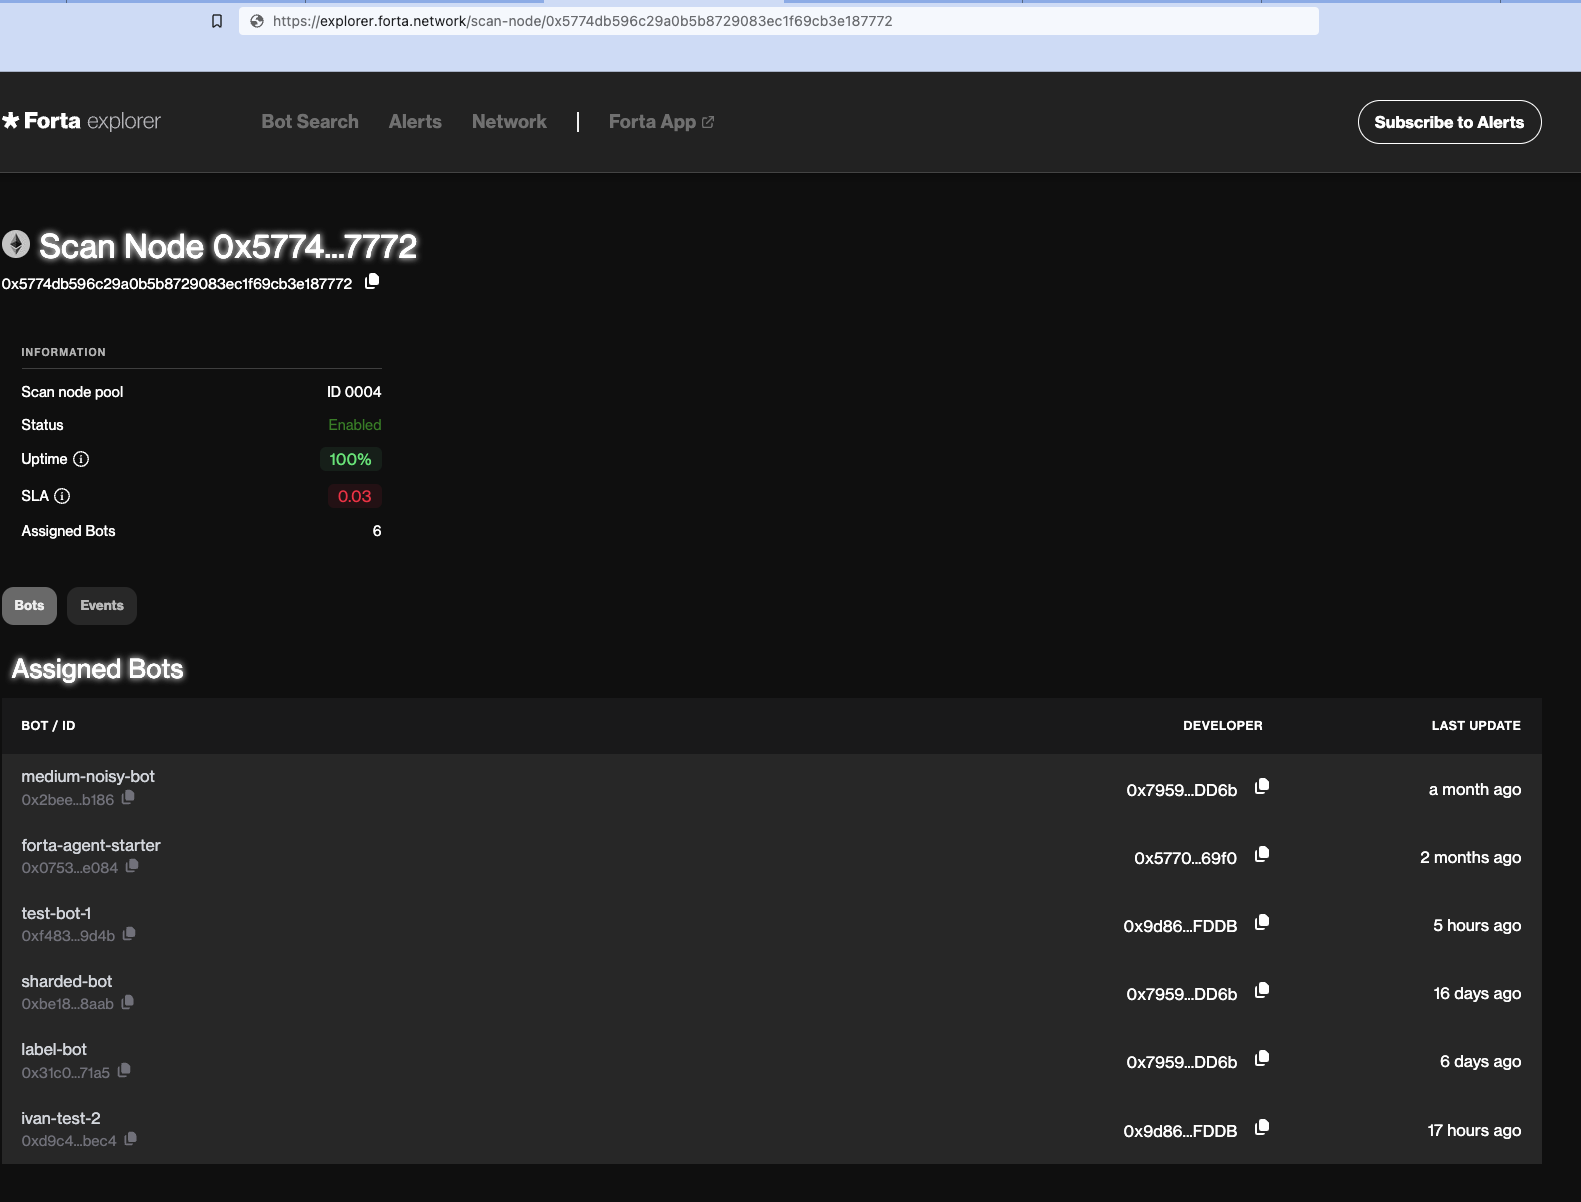
The SLA score is a performance score calculated by using the reports the scan nodes are sending. It is used in calculating rewards and making bot assignments. To learn more about how it is calculated, please visit the SLA page.
The largest factor in SLA calculation is the number of the latest block scanned.
To view your scan node's uptime and SLA simply copy and paste
into your browser's search bar.
You can use the SLA API for more details insights.
Please note that the number in Forta App can differ from what SLA API returns because of time range differences (see Q3 in FAQ).
Prometheus
The health reports presented in the Health section are transformed to metrics and exposed from a Prometheus handler, by the running forta process. This makes it possible to collect and observe these metrics by following these steps:
1. Configure the Prometheus port on the node (Optional)
This step is optional and the default value is 9107. You can configure to a custom value (e.g. 3333) by adding this to your node config:
2. Start a Prometheus container
Create a prometheus.yml file like
global:
  scrape_interval:     10s
  evaluation_interval: 10s
scrape_configs:
  - job_name: 'forta'
    static_configs:
      - targets: [localhost:9107]
and then do
docker run --rm --network host -p 9090:9090 -v $(pwd)/prometheus.yml:/etc/prometheus/prometheus.yml prom/prometheus
3. Start a Grafana container
4. Make a Grafana dashboard
Visit the Grafana UI at http://localhost:3000 and then open "Connections" from the menu on the left. You can add your Prometheus container as the source of your Forta node. Find "Prometheus" from among the data sources and add new connection.
Then, visit "Dashboards" from the menu on the left, click on "New" and then "Import".
You can import this dashboard export to get started!
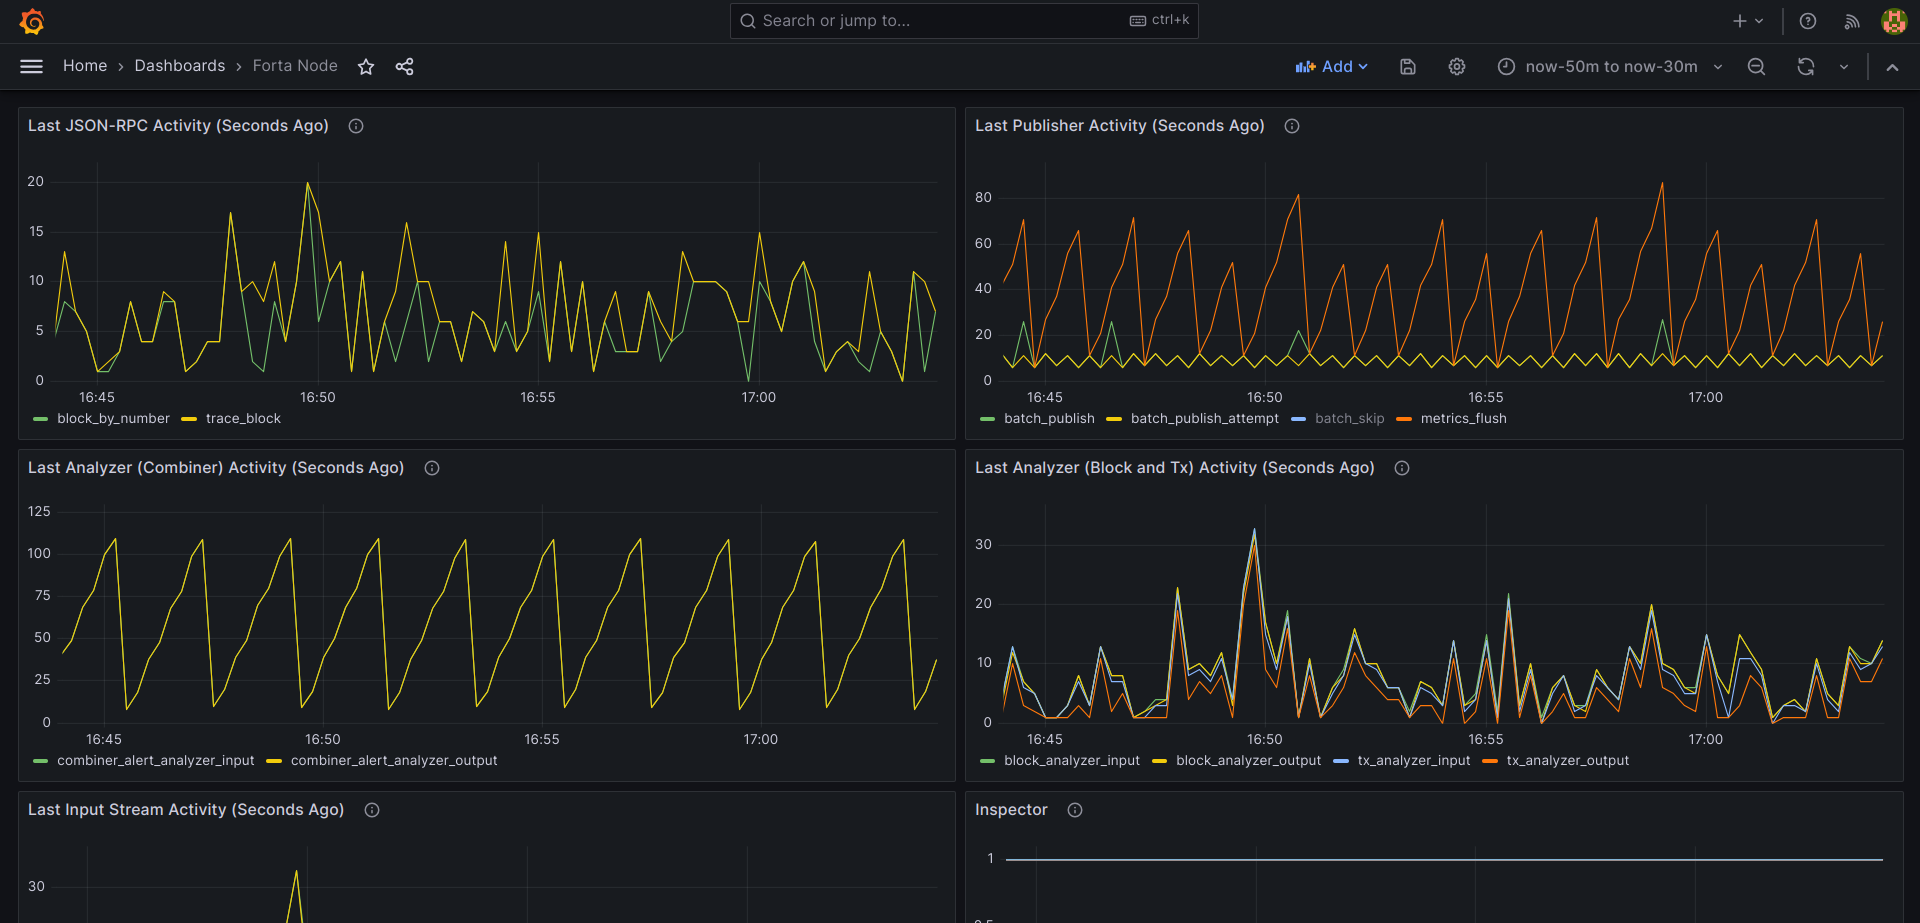
Interpreting the metrics
The metrics mostly represent the time elapsed since the last action.
Most of the metrics have an internal meaning so let's list them down with their tags and explain what they actually signal to us:
forta_json_rpc_activity_seconds
This is the first layer of streaming block data to the bots. The values represent the delay since last activity.
block_by_number(scan API request)trace_block: (trace API request - hide/ignore unless scanning Ethereum or Fantom)
forta_stream_activity_seconds
This is the second layer of streaming block data to the bots. The values represent the delay since last activity.
tx_stream_blocktx_stream_tx
forta_analyzer_activity_seconds
This is the third layer of streaming block data to the bots. It is also the final layer where the outputs from the bots are collected. The values represent the delay since last activity.
(Combiner/combination means inputting previous alerts to bots.)
block_analyzer_inputblock_analyzer_outputtx_analyzer_inputtx_analyzer_outputcombiner_alert_analyzer_inputcombiner_alert_analyzer_output
forta_publisher_activity_seconds
This is the layer where the alerts are sent out from the node. The values represent the delay since last activity.
batch_publish_attempt: Checking conditions to send an alert batchbatch_skip: Skipping to send a batch because it is not necessary (hide/ignore if very large)batch_publish: Sending an alert batchmetrics_flush: Sending bot and system metrics inside the batch
forta_inspector
This metric includes various inspector values visible in the forta status all | grep inspector output.
Values:
1: OK-1: Not OK-3: Unknown/irrelevant
forta_bot_registry_activity_seconds
This metric is relevant to checking the list of assigned bots. The values represent the delay since last activity.
check: A bot registry check attemptchange_detected: Either a change in assignments were detected or synchronization was forced (e.g. after 5m)
forta_active_bots
The values represent the counts.
total: How many bots the node is currently doing I/O withlagging: How many bots are slow at processing inputs and are missing newer inputs
Errors
Tags from various different metrics represent visible errors.
Values:
0: No error visible1: An error is visible
Tags:
forta_bot_registry_errors-check: Checking the list of assigned botsforta_json_rpc_errors-trace_block: Trace API requestsforta_publisher_errors-batch_publish: Publishing alert batchesforta_telemetry_errors-bot_logs_sync: Sending bot container logsforta_telemetry_errors-telemetry_sync: Sending to public telemetry handlerforta_telemetry_errors-custom_telemetry_sync: Sending to custom telemetry handler (if specified in config)
Telemetry
The health reports presented in the Health section are forwarded to Forta telemetry handler every 5 minutes, after sensitive data is obfuscated (e.g. API URLs that contain keys). This is useful for core developers to understand what is going on with scan nodes and resolve issues.
You can specify a custom telemetry handler in the config.yml file if you would like to receive these health reports from your nodes every minute:
The forwarded content is a gzipped JSON which is similar to the forta status --show all --format json output.
[
  ...
  {
    "name": "forta.container.forta-scanner.service.agent-pool.agents.total",
    "status": "ok",
    "details": "14"
  },
  {
    "name": "forta.container.forta-scanner.service.block-analyzer.event.input.time",
    "status": "ok",
    "details": "2022-08-17T10:36:20Z"
  },
  {
    "name": "forta.container.forta-scanner.service.block-analyzer.event.output.time",
    "status": "ok",
    "details": "2022-08-17T10:36:20Z"
  },
  {
    "name": "forta.container.forta-scanner.service.block-feed.last-block",
    "status": "info",
    "details": "15358230"
  }
  ...
]